
Funding Program Dashboard
The following figures represent a possible equity dashboard for DEQ Oregon. Some of the questions that each figure provides answers to are listed to the left of each figure.
Figures 1-3 are built using existing data. Figures 4-15 require additional data to be collected, and are shown here using placeholder data. A full list of required data for these figures is listed at the bottom of the dashboard.
The figures on this dashboard were designed to reflect the equity-related metrics we recommend for DEQ Oregon in its implementation of grant administration.
These metrics include the relative proportion of grant dollars applied for and granted by:
race of organization leadership (small businesses & nonprofits) or population served (small governments and public schools)
gender of organization leadership (small businesses & nonprofits) or population served (small governments and public schools)
region
county
type of organization
type of activity proposed
type of funding requested
reason for rejection
In addition, the data above should be available for different date ranges to allow comparisons across different grant implementation strategies.
Using these metrics, DEQ Oregon will be able to ask questions such as:
Are applications from white-led small businesses approved at a higher rate than applications from BIPoC-led small businesses? Is this the case in some regions more than others?
Are applications from any group (e.g. BIPoC-led non-profits, public schools in the Eastern Region) increasing or decreasing over time? (This will be particularly relevant to evaluate specific engagement strategies.)
Are applications being submitted for particular project types at different rates for different types of communities or in different regions?
Once DEQ Oregon identifies specific equity goals for the grant program, these questions can be tailored more specifically to provide details on progress (e.g. % increase in applications among a particular population for a particular type of project).
It is critical that baseline data be established using consistent and well-defined categories for each data variable.
Figure 1: Total dollars requested, funded, and not funded by year
How has the amount of funding requested changed over time?
How has the amount of funding awarded and not awarded changed over time?
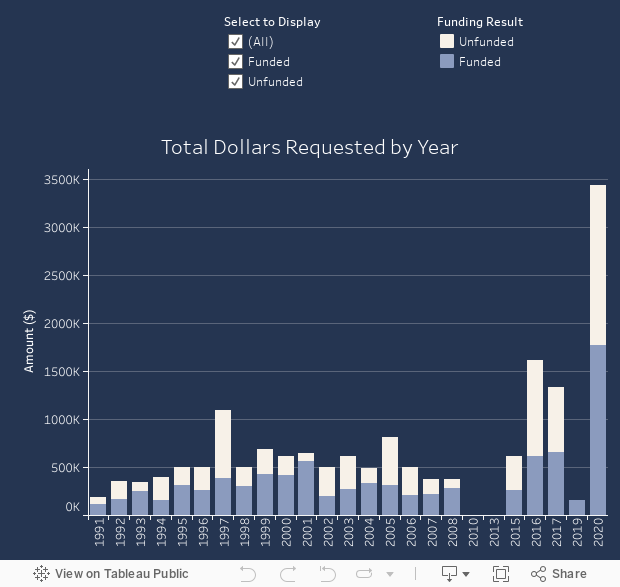
Figure 2: Total dollars requested, funded, and not funded by county and date range
What is the geographic distribution of funding requests for a particular date range?
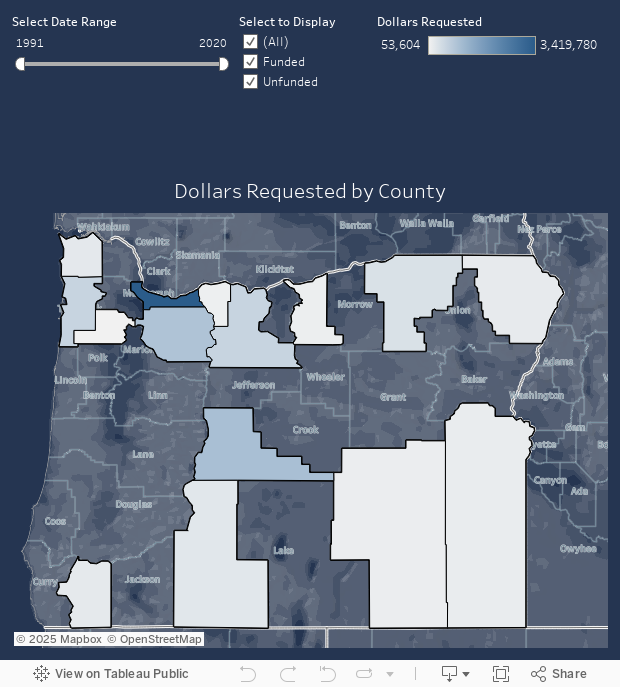
Figure 3: Total dollars requested, funded, and not funded per capita by county and date range
What is the geographic distribution per capita of funding requests for a particular date range?

Figure 4: Portion of total dollars requested by organization type over time
Aspirational! Data needed to produce this figure with real data: organization type
Which types of organizations are applying for funding?
What portion of the funds requested are from each type of organization?
How has this changed over time?
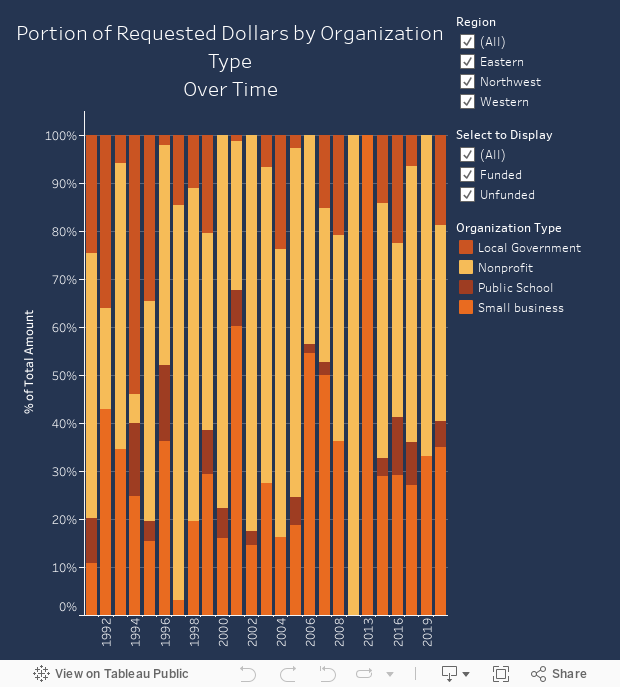
Figure 5: Total dollars requested by organization type over time
Aspirational! Data needed to produce this figure with real data: organization type
How do the amounts funded (or unfunded) differ by organization type?
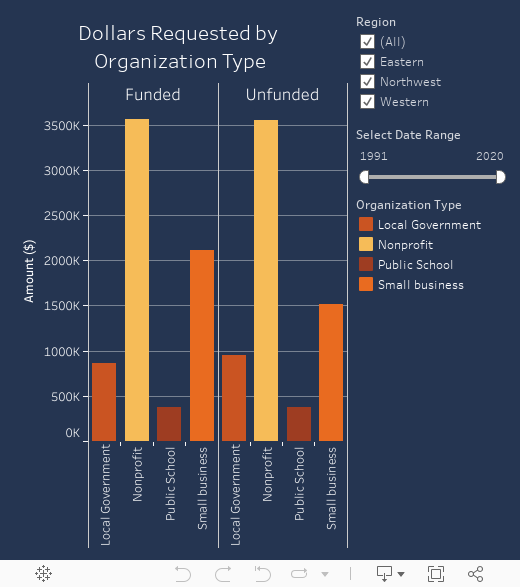
Figure 6: Total dollars requested by small businesses, disaggregated by gender identity
Aspirational! Data needed to produce this figure with real data: type of organization, gender of owners (proportional by ownership amount)
For Small Businesses that apply for funding, how does the funding status differ by gender of the business owners?
For businesses with more than one owner, dollars funded/not funded are proportionately allocated by the ownership % of that owner.
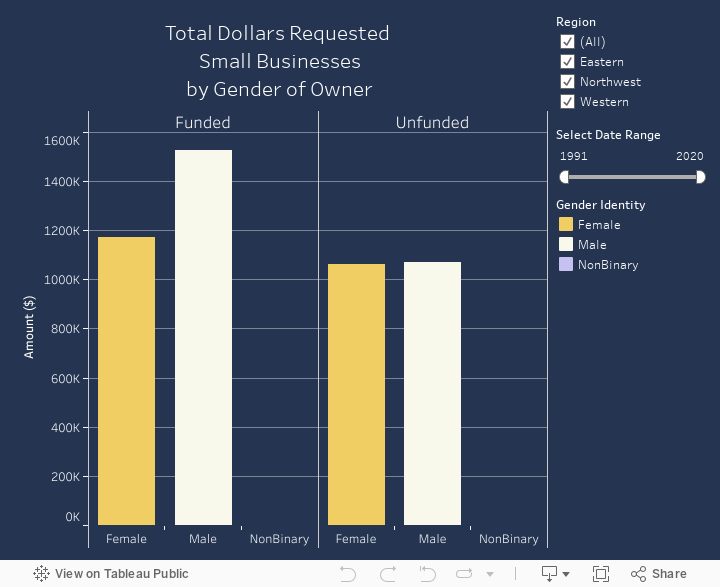
Figure 7: Total dollars requested by nonprofits, disaggregated by gender identity
Aspirational! Data needed to produce this figure with real data: type of organization, gender of board members (proportional by ownership amount)
For Non-Profits that apply for funding, how does the funding status differ by gender of the board members?
For these calculations, dollars funded/not funded are evenly allocated between all board members.
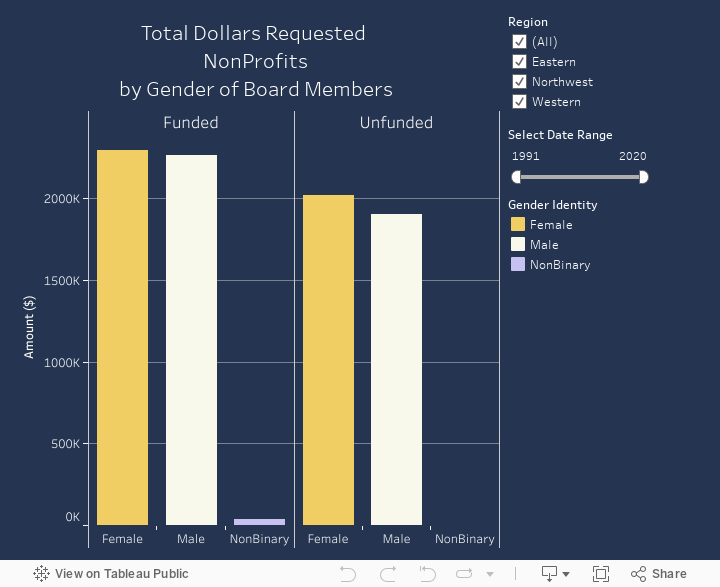
Figure 8: Total dollars requested by small businesses, disaggregated by race
Aspirational! Data needed to produce this figure with real data: type of organization, race of owners (proportional by ownership amount)
For Small Businesses that apply for funding, how does the funding status differ by the race/ethnicity of the owner(s)?
For businesses with more than one owner, dollars funded/not funded are proportionately allocated by the ownership % of that owner.
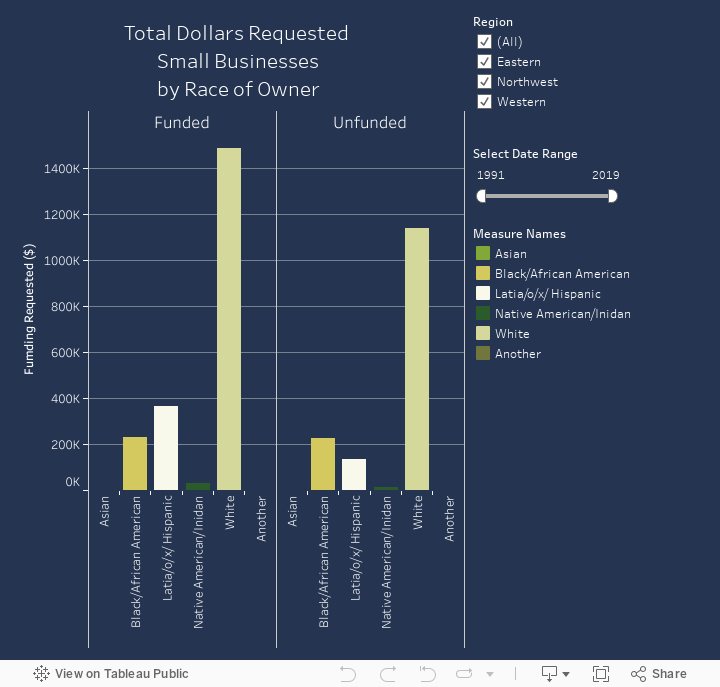
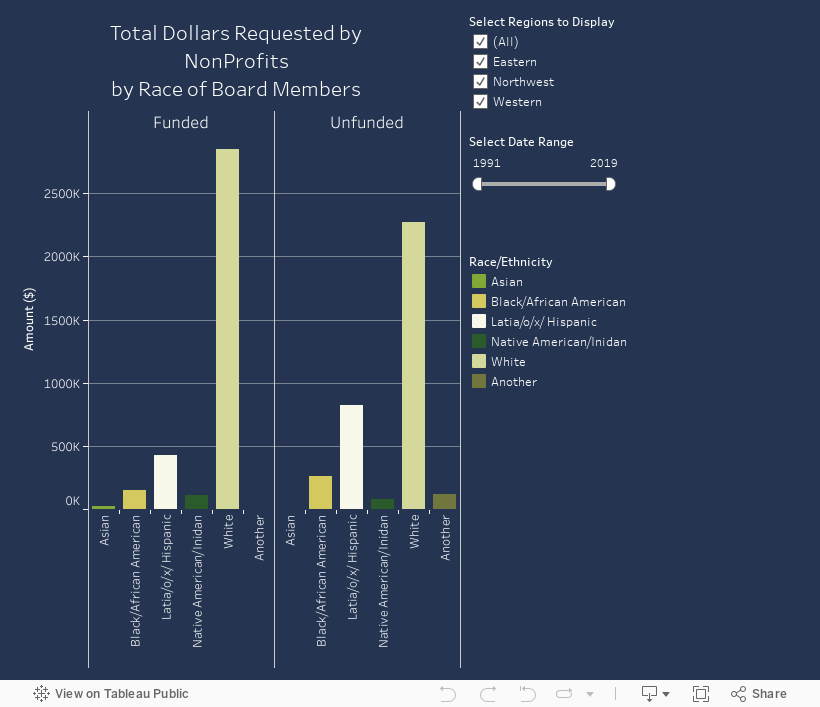
Figure 9: Total dollars requested by nonprofits, disaggregated by race
Aspirational! Data needed to produce this figure with real data: type of organization, race of board members (proportional by ownership amount)
For Non-Profits that apply for funding, how does the funding status differ by the race/ethnicity of the board members?
For these calculations, dollars funded/not funded are evenly allocated between all board members.
Figures 10 & 11: Total dollars requested by local governments and public schools, disaggregated by race of population served
Aspirational! Data needed to produce this figure with real data: type of organization, racial composition of population served
For Local Governments and Public Schools that apply for funding, how does the funding status differ by the race/ethnicity of the students/residents served by those entities?
For these calculations, dollars funded/not funded are allocated proportionally to the race/ethnicities in the population.
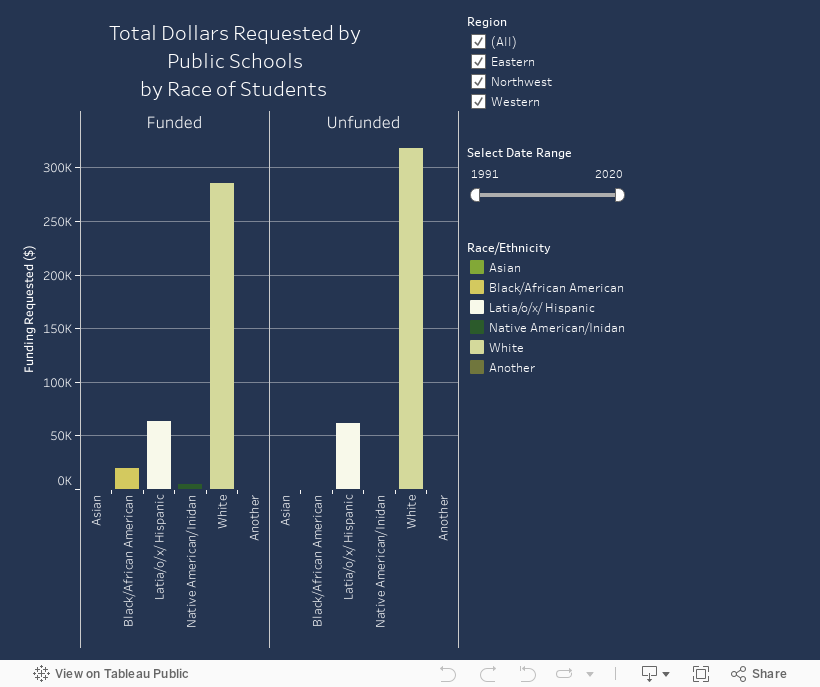
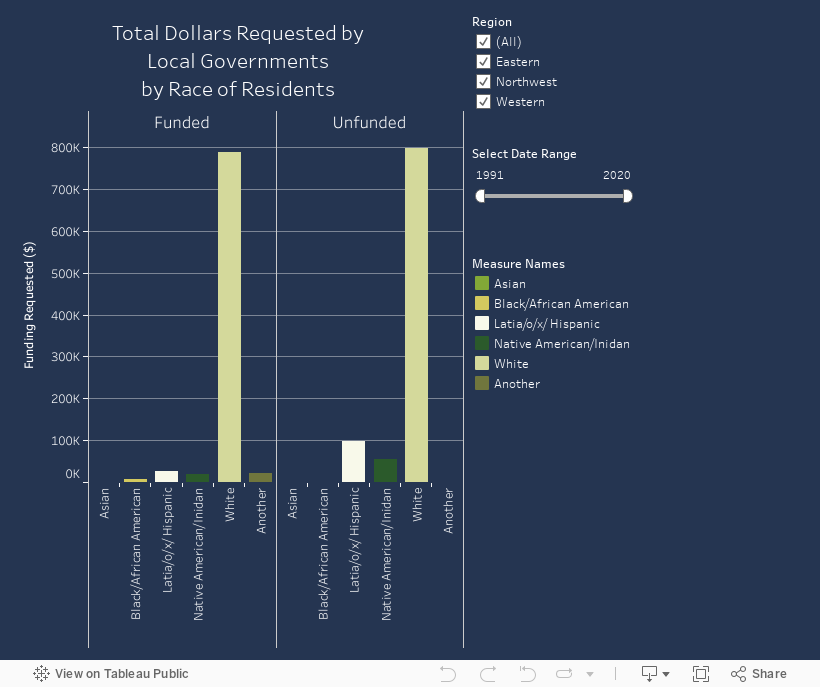
Figure 12: Total dollars requested by the type of activity
Aspirational! Data needed to produce this figure with real data: type of activity proposed
How do the amounts funded (or unfunded) differ by the activity proposed?
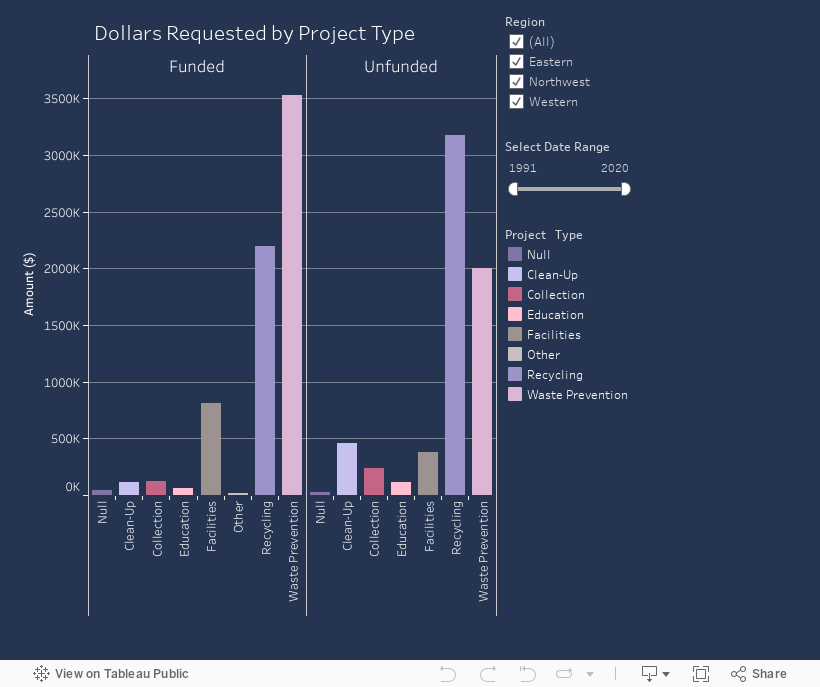
Figure 13: Total dollars requested by the type of funding requested
Aspirational! Data needed to produce this figure with real data: type of funding requested
How do the amounts funded (or unfunded) differ by the type of request?
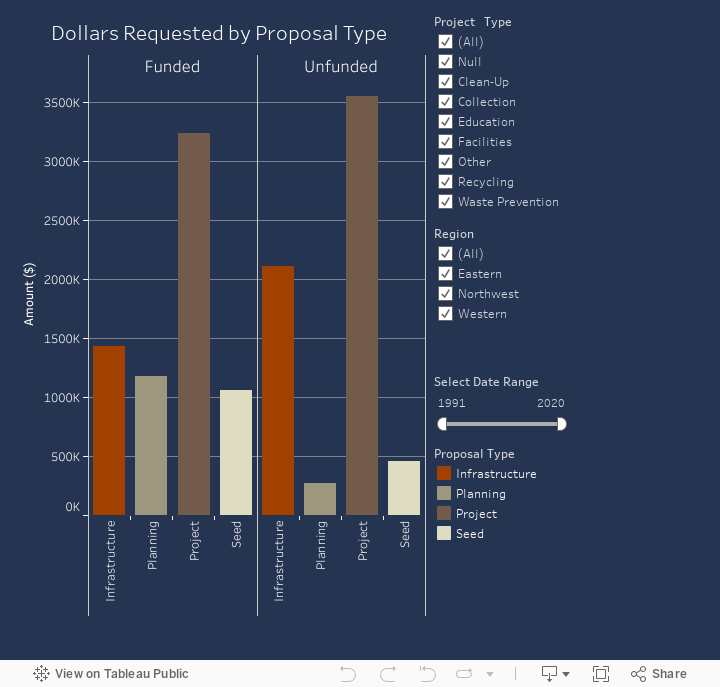
Figure 14: Reason for rejection by race of board/owners/population served
Aspirational! Data needed to produce this figure with real data: reason for rejection, race of board/owners/population served
For unfunded applications, how does the reason for rejection vary by race of the owners/board (for small businesses and nonprofits) or the constituents (for local governments and schools)?
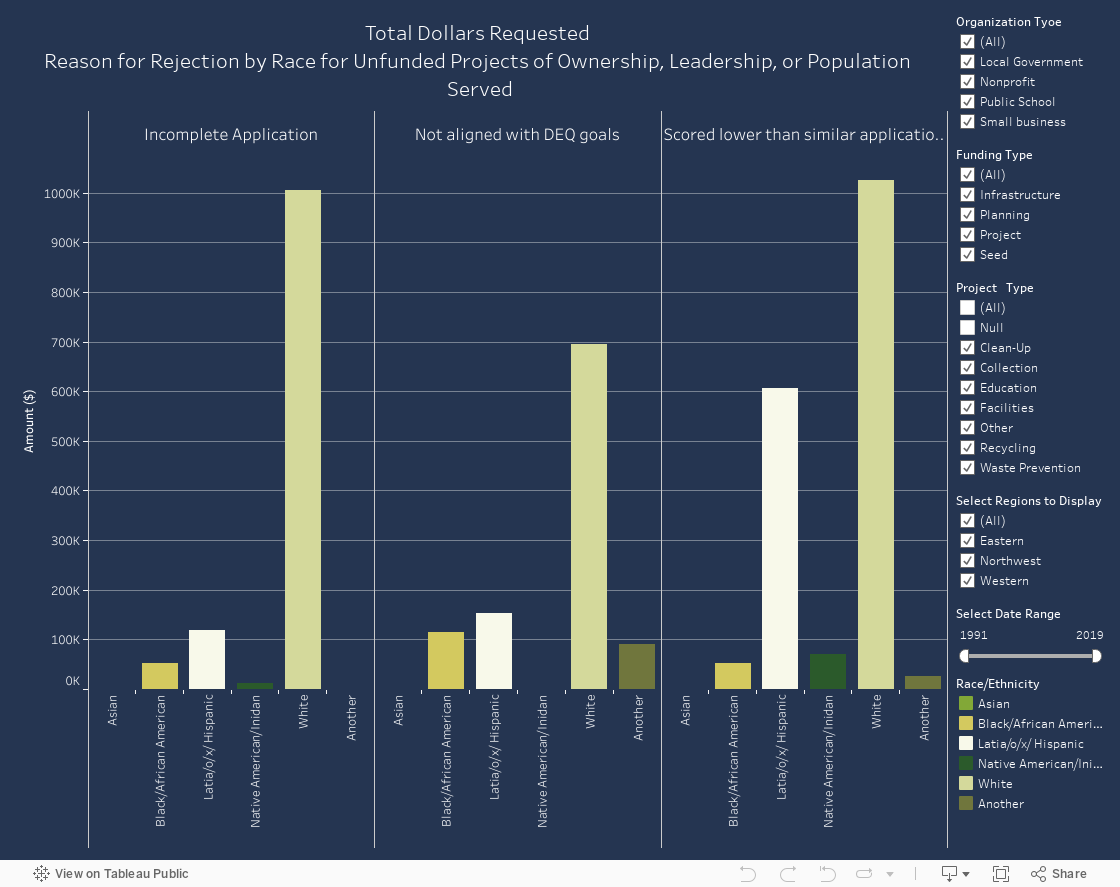
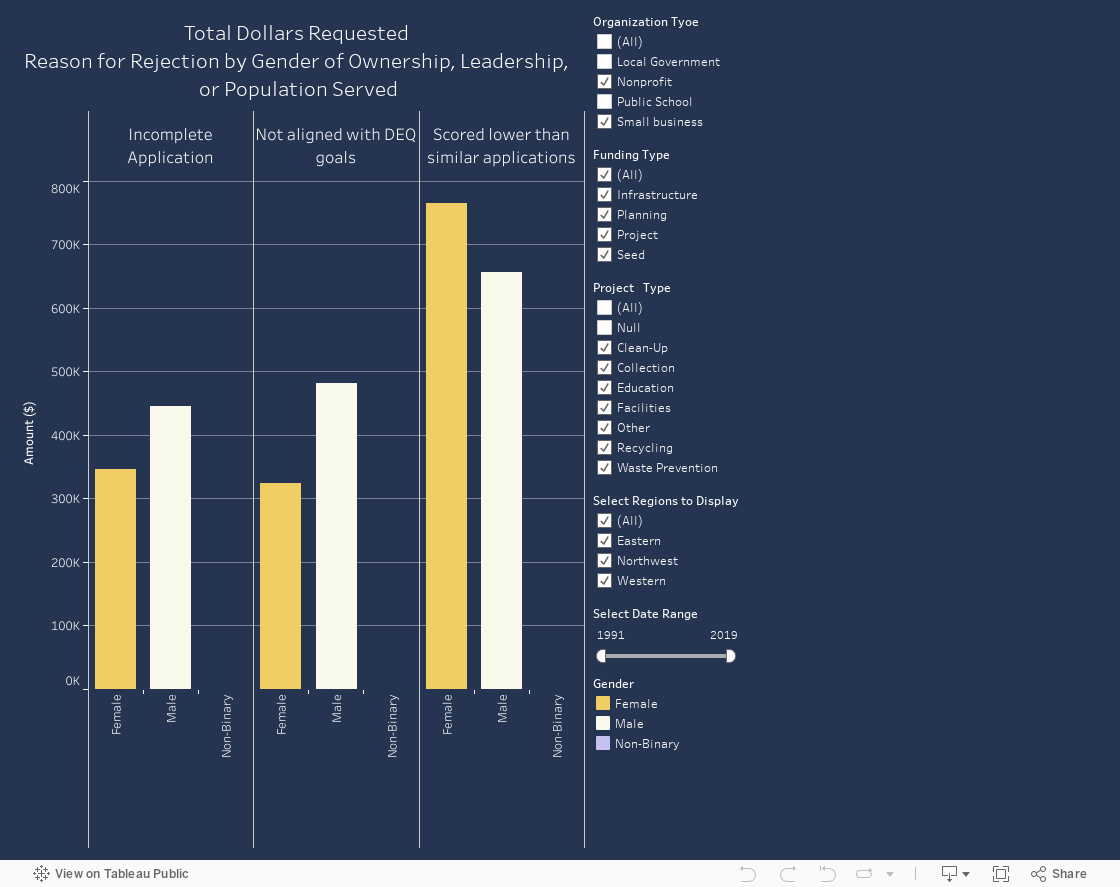
Figure 15: Reason for rejection by gender of board/owners
Aspirational! Data needed to produce this figure with real data: reason for rejection, gender of board/owners/population served
For unfunded applications from small businesses and nonprofits, how does the reason for rejection vary by gender of the owners/board?
Data Collection Recommendations
Application
Year
Amount ($)
Project Area
urban, rural, suburban
Project County
Project Region
E, W, NW
Project Type
Recycling, Waste Prevention, Clean-Up, etc.
Funding Type
Planning, Implementation, Infrastructure, overhead, etc.
Result
Accepted
% of request that was funded
Rejected
Reason for rejection
Applicant
Organization Type
NonProfit, Small Business, Public School, Non-Tribal Government, Tribal Government
Leadership/Population served
Gender of board members/owners/students/population
% female, male, nonbinary, another option
Race of board members/owners/students/population
% African, Alaska Native, Indian/Native American, Asian Indian, Black/African American, Carribian, Chamorro, Chicana/o/x, Chinese, Cuban, Filipino, Hispanic, Japanese, Korean, Latina/o/x, Mexican, Middle Eastern, North African, Native Hawaiian, Pacific Islander, Puerto Rican, Samoan, Vietnamese, White, multiple racial identities, another racial identity
Stages
Attended info session, submitted application, applied previously, awarded funding previously