
Washington State
Risk, Resilience, and Community-Focused Circular Economies
Identifying Community-Focused Circular Economy Initiatives and Overlaps with Community-Resilience and Risk Burdens
Agenda for group call
Intro - 10 mins
Who’s in the room:
Okanogan County, Name, Org, Location, Pronouns (Optional)
King County, Name, Org, Location, Pronouns (Optional)
Agreement:
Step up, Step Back
Goals:
Understand silos and opportunities for connections between resilience efforts and circular economy.
Understand how these maps below make community needs and resilience actions visible.
Understand how these maps might be a resource for funders and capacity builders to take action in overburdened communities.
Learn what additional data will support these efforts.
Understand above experiences/needs in the context of urban and rural spaces.
Discussion: 10-15 mins
Map Review: 25 mins (11:30)
Wrap up - 5 mins
Definitions
Community Resilience
Wikipedia definition: Community resilience is the sustained ability of a community to use available resources (energy, communication, transportation, food, etc.) to respond to, withstand, and recover from adverse situations (e.g., economic collapse to global catastrophic risks).
Circular Economy
Ellen MacArthur Foundation definition: The circular economy is based on three principles, driven by design:
Eliminate waste and pollution
Circulate products and materials (at their highest value)
Regenerate nature
Research Questions - 15 mins
How do you see circular economy activities (e.g. repair, reuse, share, and/or compost) as components of community resilience?
Does this change when thinking about times of emergency vs calmer times?
What would “unstuck you” in connecting community resilience to the circular economy?
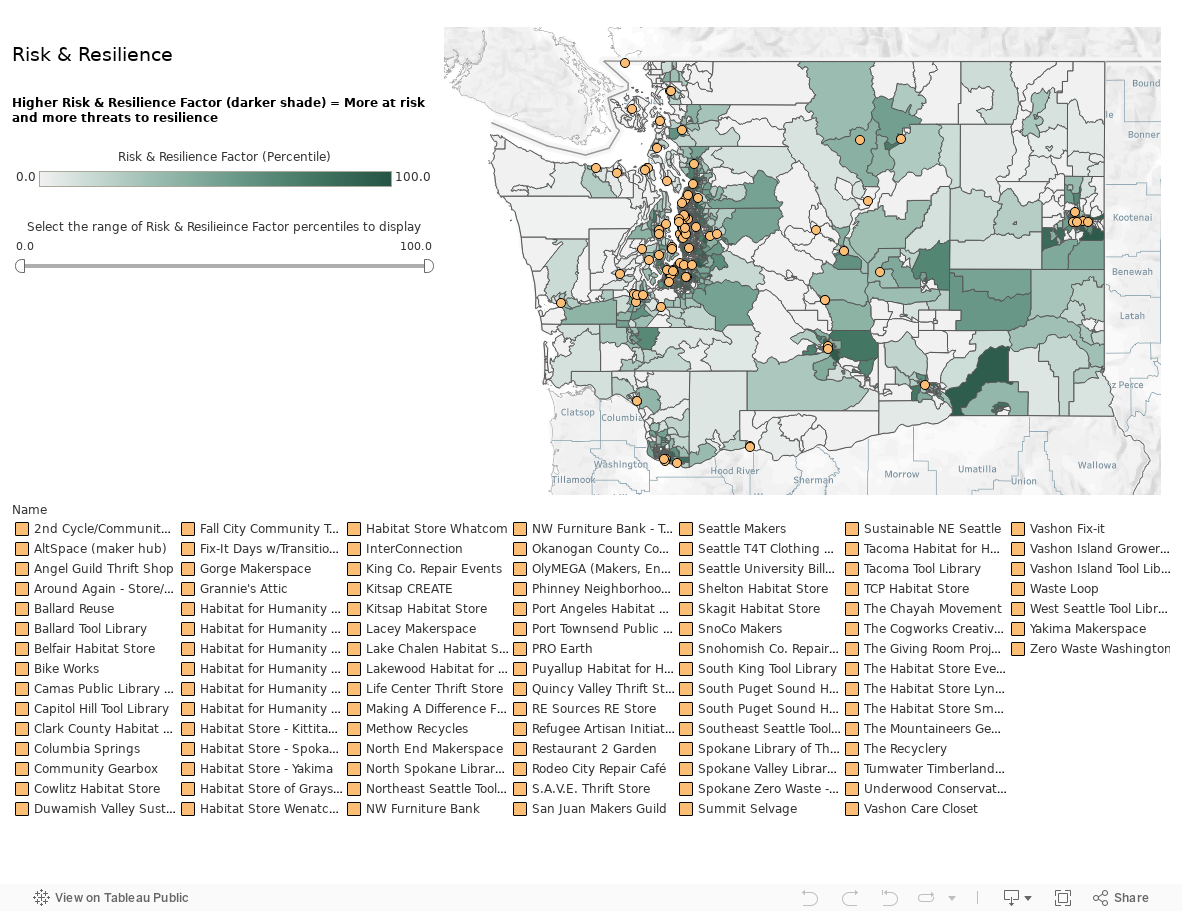
Risk & Resilience Burden
This map shows community-focused circular economy initiatives (e.g. share, reuse, compost, repair), in the context of the economic, social, and environmental risks those communities face and the burdens that compromise their ability to respond to those challenges. Census tracts with darker shades are more at risk and have more threats to resilience than other census tracts in Washington.

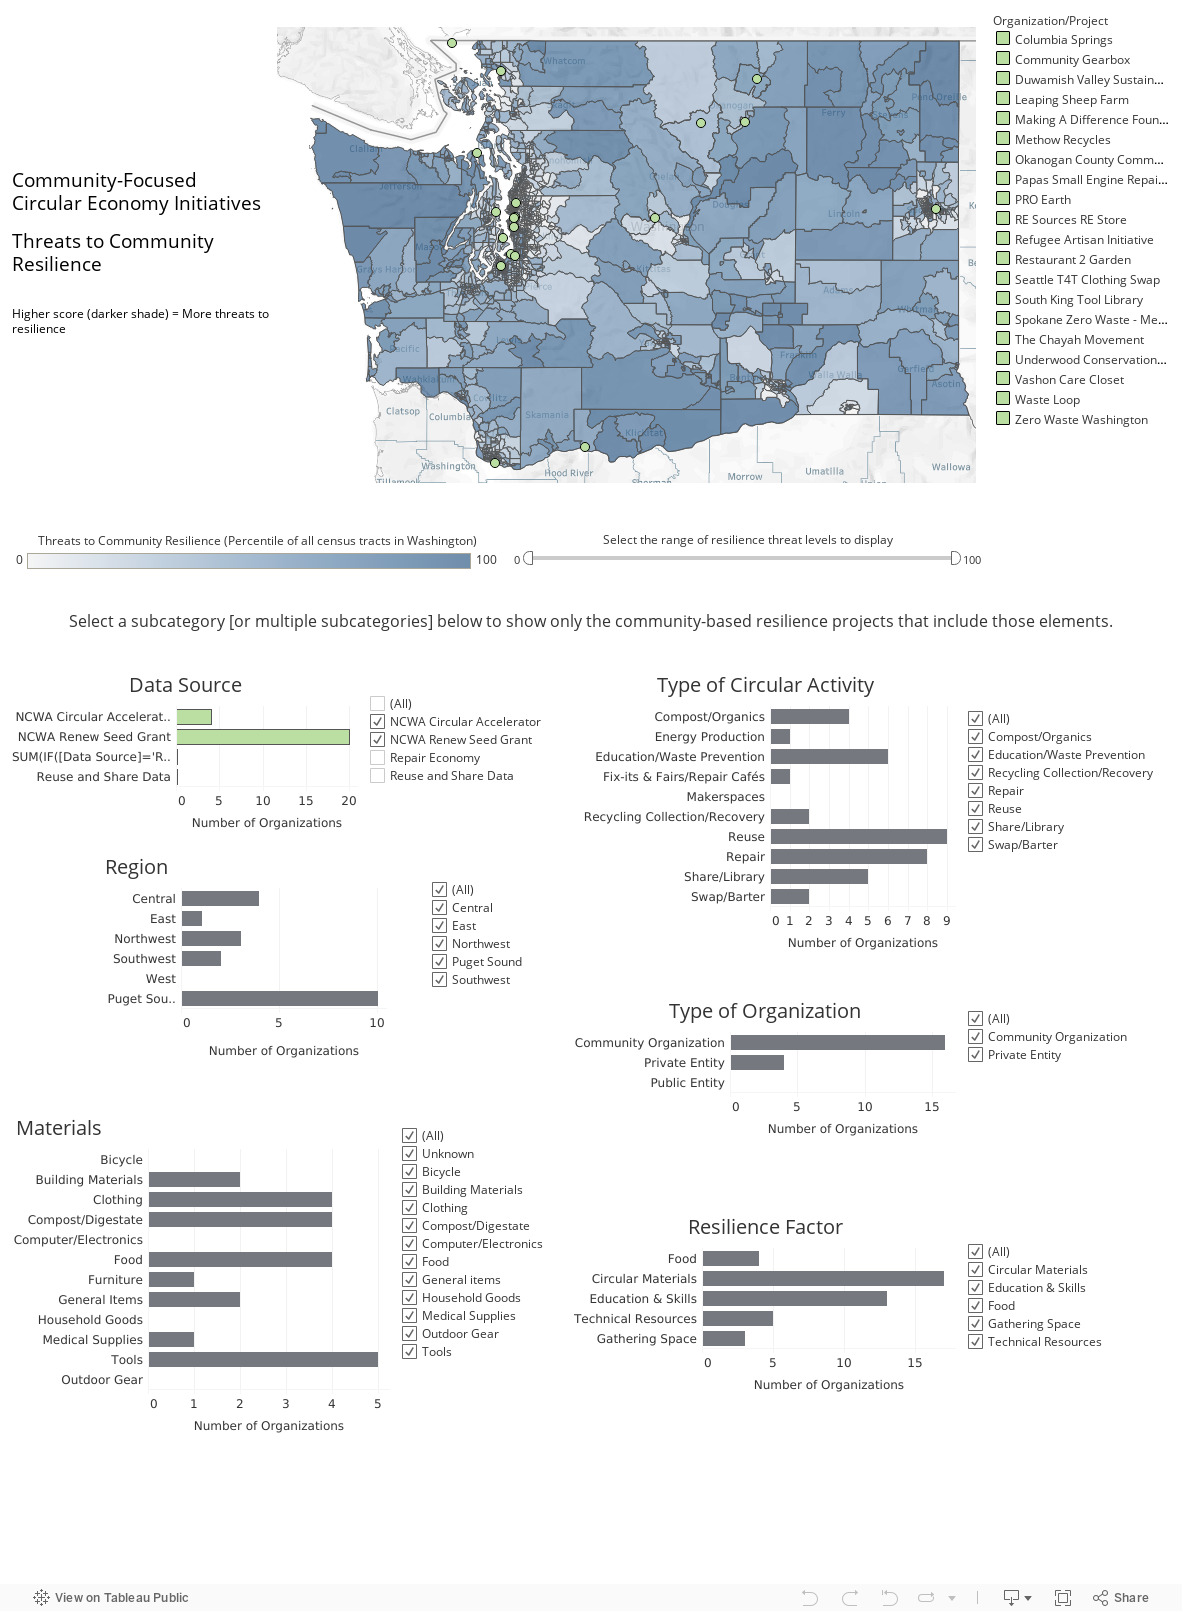
Threats to Resilience
This map shows economic, health, & social factors that are likely to compromise ability of community to recover from stressors (acute & chronic)
X

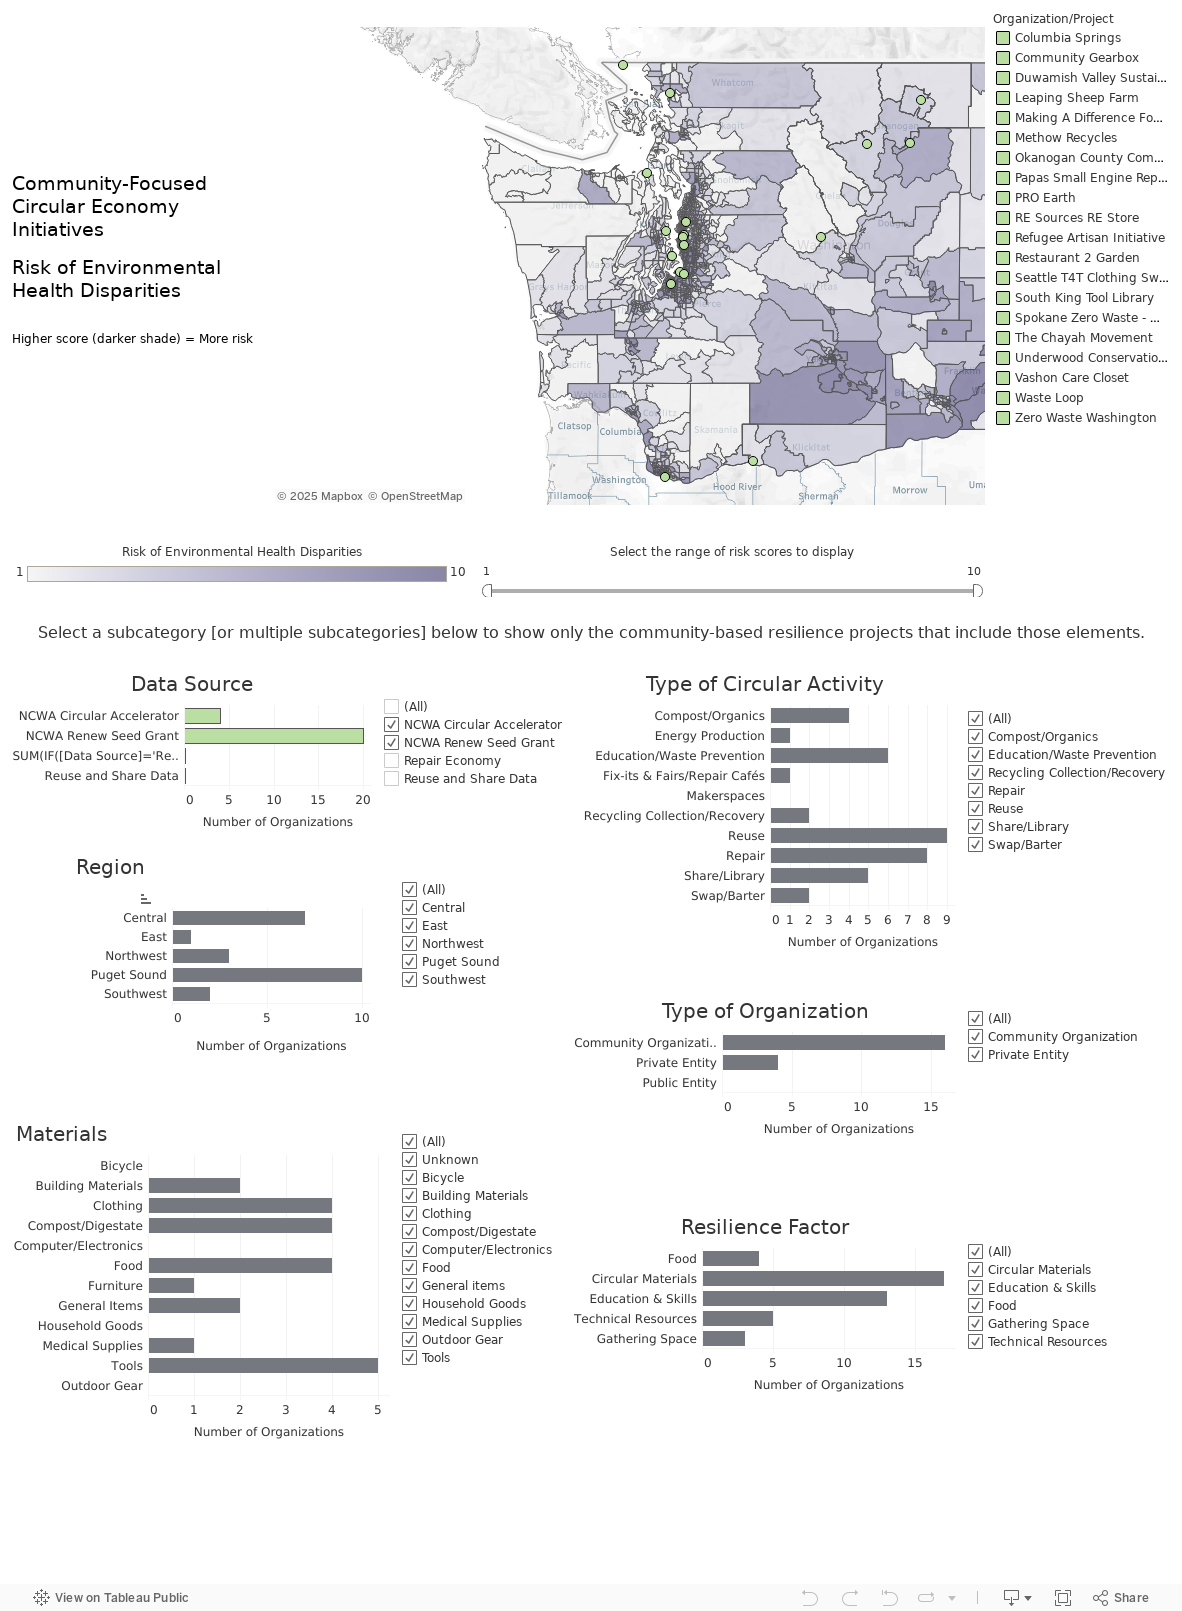
Environmental Risks
This map shows environmental risks (pollution burden, exposure to toxins, other environmental hazards) and the location of sensitive & vulnerable populations.
=
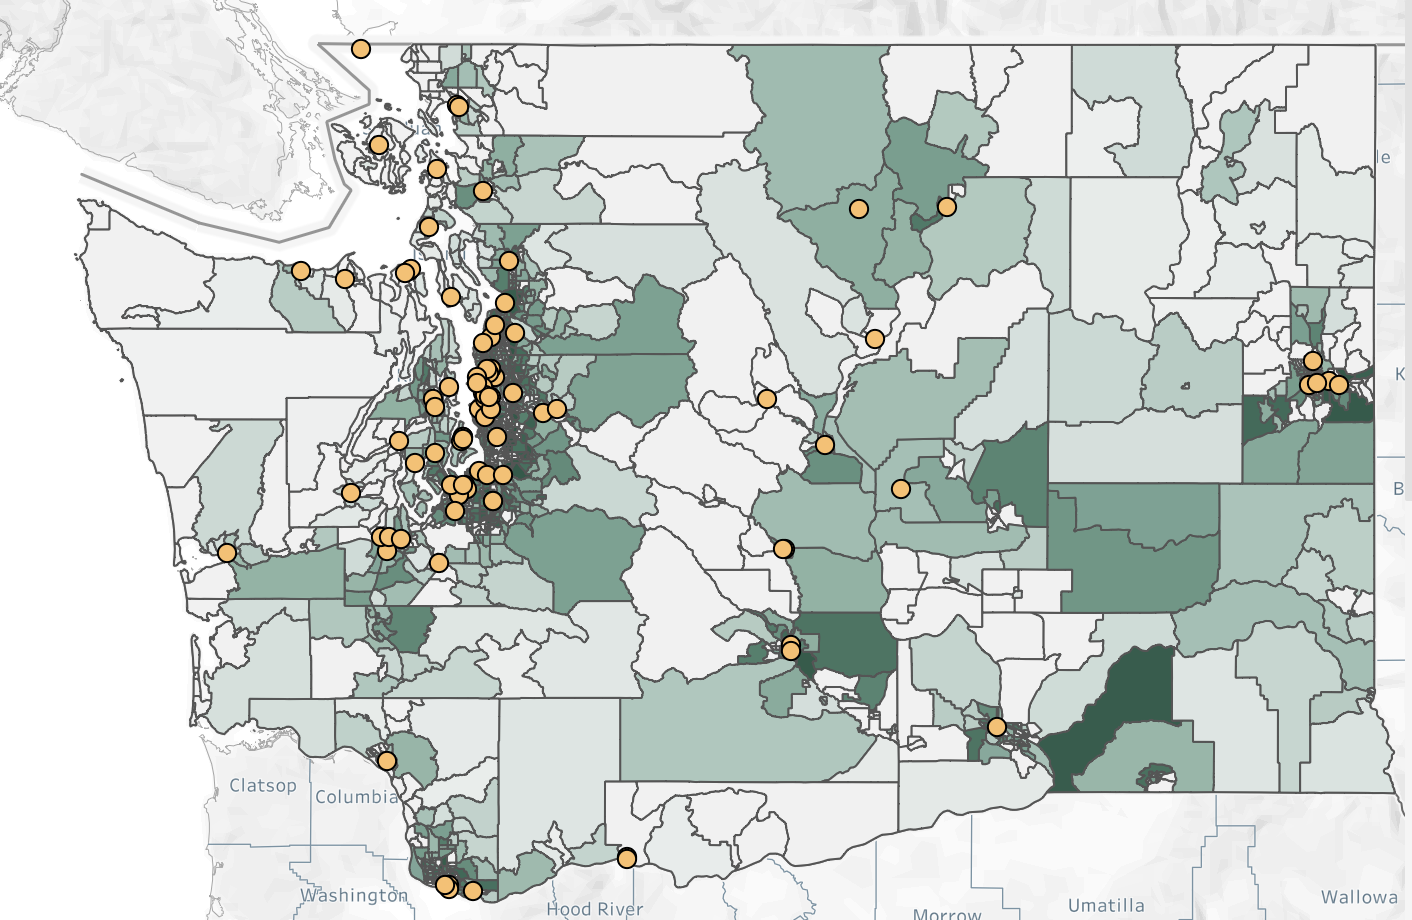
Risk & Resilience Burden
This map shows where there are areas of both high risk of environmental threats and challenges to resilience.
Regarding the maps we’re about to show you: 25 Minutes
Does it affirm any of the thoughts you had about connections (or lack there of) between community resilience and the circular economy?
Would you use this? How?
Would you share it with others? Who and why?
What’s missing in these maps?
Regarding the maps we’re about to show you:
Does it affirm any of the thoughts you had about connections (or lack there of) between community resilience and the circular economy?
Would you use this? How?
Would you share it with others? Who and why?
What’s missing in these maps?
Regarding the maps we’re about to show you:
Does it affirm any of the thoughts you had about connections (or lack there of) between community resilience and the circular economy?
Would you use this? How?
Would you share it with others? Who and why?
What’s missing in these maps?

How are the scores calculated?
There are three scores used in the maps above:
Community Resilience (Blue Map)
Environmental Health Disparities Risk (Purple Map)
Risk & Resilience Burden (Green Map)
Environmental Health Disparities Risk
This score is directly from the Washington Environmental Health Disparities Map, a tool developed by the Washington State Department of Health. This map uses a variety of publicly available data and uses it to calculate a single score intended to show the risk each community in Washington faces from socioeconomic and environmental factors.
Using the variables listed at right and the methodologies described here, each census tract in Washington was assigned a score between 1 and 10, where 10 (shown on the map above as a darker shade) indicates more risk.
Community Resilience
The FEMA Community Resilience Challenges Index utilizes 22 indicators (3 of which overlap with the Environmental Health Disparities Risk index) to calculate a measure of the relative potential resilience across the country. The data is then displayed as the percentile rank (0 to 100) for each census tract in relation to the others in the set (in our case, Washington State), where a higher rank (shown on the map above as a darker shade) indicates more challenges to resilience..
Risk & Resilience Burden
Recognizing the compounding relationship between the risk a community is exposed to and their ability to be resilient in response to those stressors, the Risk & Resilience Burden is calculated for each census tract as:
(Washington Environmental Health Disparities Risk Score) * (FEMA Community Resilience Challenge Index)
The data is presented here as percentile rank, comparing each census tract to all other tracts in Washington State. For example, if a census tract has a percentile rank of 70, this indicates that 70% of all census tracts in Washington State have a lower Risk & Resilience Burden.
